Observe the health of a customer journey
Track and monitor KPIs weekly with dashboard metrics.
Metrics associated with each journey step can be monitored on a dashboard and linked to an existing Analytics dashboard for more customization. Multiple metrics should be added to a single journey step to offer a comprehensive view of the journey.
-
From the dashboard the following tiles are available.
Note: The tiles in the Health Status dialog can not be customized, however an analytics dashboard can be linked to a customer journey where metrics can be customized from there.
Options Description Average Value 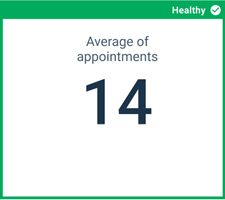
The average score for the week based on metrics set in the data source. Values History 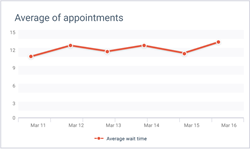
The average score for the last few weeks.